For people leaders, there are few more rewarding feelings than garnering a positive response from employees. And this includes more than just high ratings on your quarterly workplace satisfaction survey.
Employee actions speak far louder than survey responses, and possibly the most telling action an employee can take in the context of their relationship to their employer is to stay with the company for a long time.
That’s why employee retention is a top priority for nearly every organization. When you retain your best talent, your business saves on recruitment costs, improves productivity and fosters a better overall employee experience.
But this feat is much easier said than done. To truly understand retention and pinpoint which initiatives are needed to influence it, you must understand how to measure it properly. Let’s review the 7 retention metrics you should be tracking, how often to revisit them and how to use these insights to fuel your greater talent management strategy.
The importance of revisiting which employee retention metrics you’re tracking
It’s likely that you already have a strategy in place to boost retention and mitigate turnover. However, it’s important that you regularly revisit this strategy (and the metrics you’re tracking as part of it) to ensure that these data points accurately reflect your evolving workforce.
There may be new or underutilized metrics you might be missing out on that could help you paint a clearer picture of employee behavior and key factors of influence.
7 most important retention metrics for your talent management strategy
These metrics offer a broad perspective on employee retention that can be viewed as the foundational components of your measurement strategy.
Employee retention rate
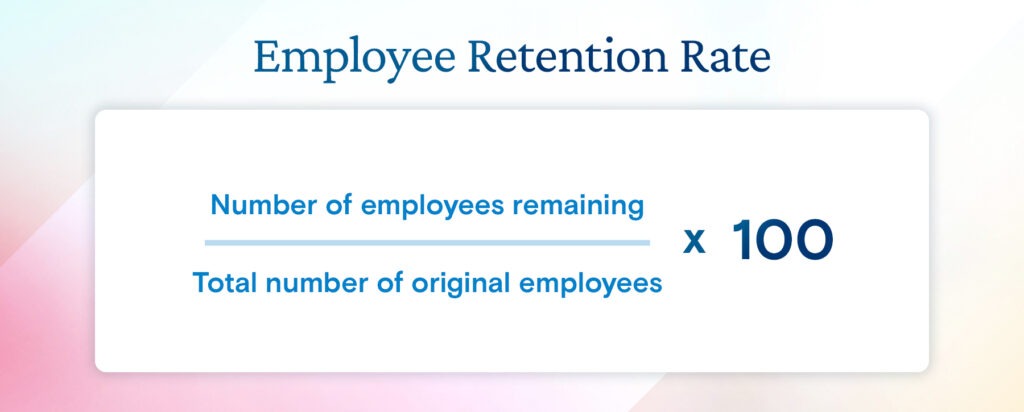
Employee retention rate indicates what percentage of your employee base is staying with your company.
To measure, set a timeframe for which you want to monitor retention. For example, let’s say a one-year period. Then, you will divide the number of employees who remained with your company within that time period by the total number of employees). Finally, multiply the number by 100 to produce a percentage value.

What is a good employee retention rate?
What’s considered to be a good retention rate varies widely across industries and job functions. For instance, industries such as retail or hospitality tend to experience high turnover and would consider a retention rate of 70% or higher as being good. In other industries, such as professional services, a retention rate of 90% or higher is viewed as a standard benchmark to measure against.
In addition to industry, it’s also important to monitor employee retention rates by varying levels or roles within the company. These can be distinguished by seniority, manager vs. direct report, or whatever categorization is most relevant to your workforce. Calculate retention rates for each category and compare them side-by-side for insight into potential disparities.
Turnover rate
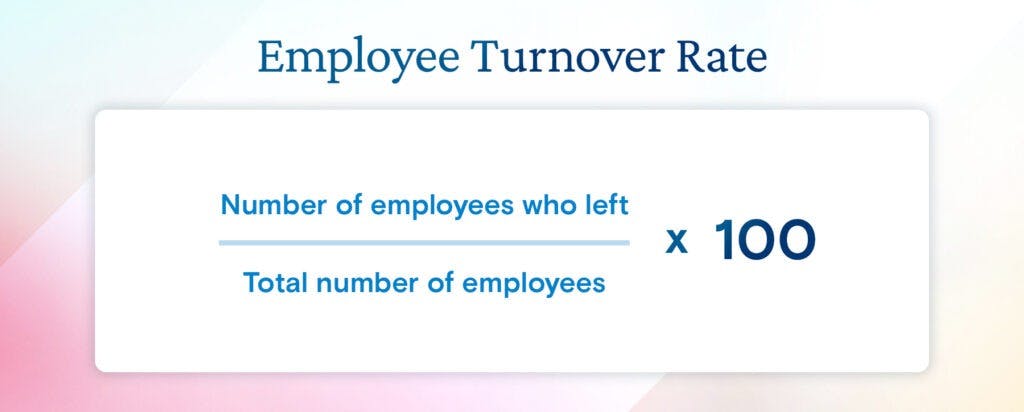
Turnover rate is the percentage of your employee base that has left your organization within a given time frame. This metric can be measured using this formula:

What is a good turnover rate for employees?
Similar to retention, what’s considered a good turnover rate is largely dependent on industry and job type. A generic benchmark to reference is somewhere between 12% and 20%.
Read more: Check out these 6 easily actionable tactics you can implement to help you minimize turnover.
Employee turnover cost
Employee turnover cost is the price tag your business pays to fill vacant roles and address employees leaving.
While this may look different depending on what you define as the most important variables, the total number can include:
- Costs of hiring and onboarding
- Costs of resources and technology used for recruitment, training and onboarding processes
- Losses associated with diminished productivity as time and resources are redirected to filling critical vacancies
- Costs associated with benefits or severance for the departing employees
Employee satisfaction
Employee satisfaction measures how your people feel about your company in general, but can be further narrowed down to monitor satisfaction related to their job, work environment, managers, benefits and more.
To measure satisfaction, it’s a best practice to use a variety of methods and at different stages in the employee lifecycle. These information-gathering methods can include one-on-one conversations and surveys. The employee satisfaction index (ESI) is one popular framework that assigns a ranking based on answers to survey questions and calculates a final total.
Average employee tenure
Average employee tenure gauges how long employees stay with your company after they are hired.
To calculate tenure, you need to have access to data that shows how long employment lifetimes last within your organization. Again, you can specify a timeframe to make comparative measurements between two periods. To find the average, simply add the total amount of time worked and divide that by the total number of employees.
This measurement can be helpful if you want to see how certain initiatives impact retention. For example, if you rolled out a new benefit this year that you did not offer the year prior.
Absence rate
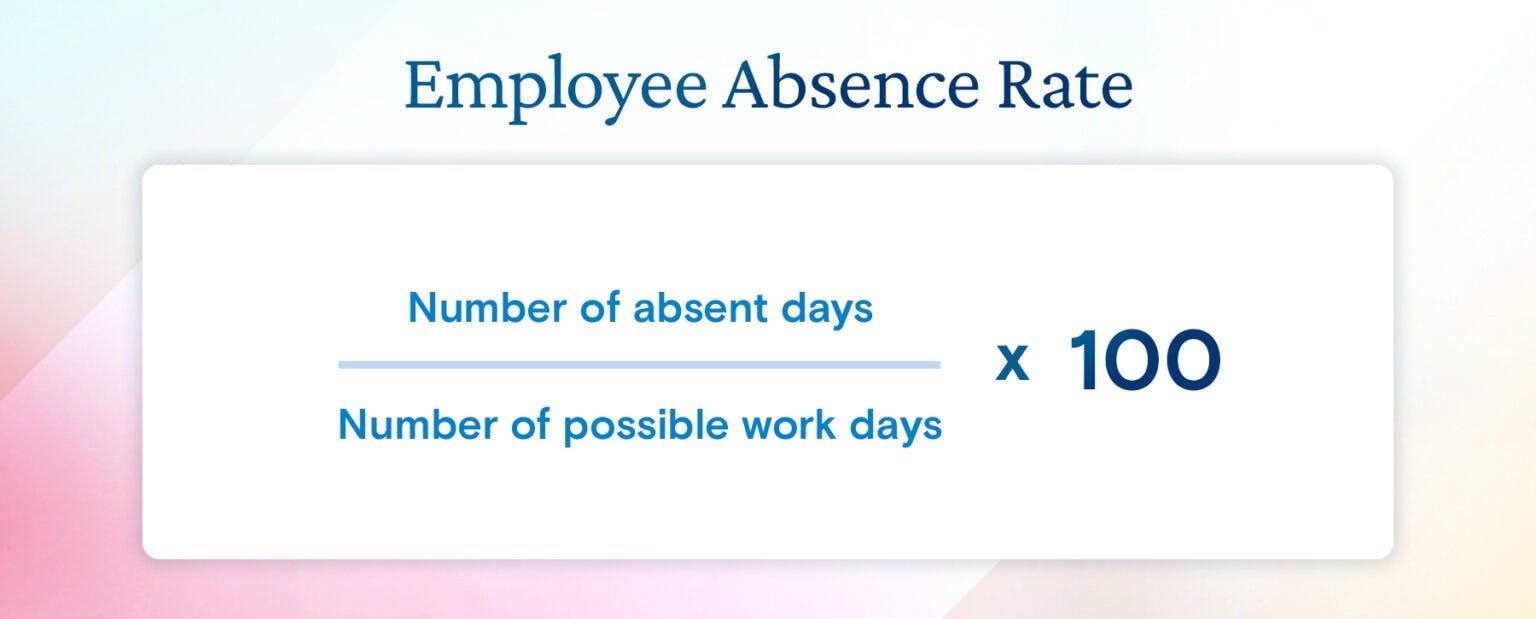
Absence rate indicates the number of unexcused absences your employees experience within a given timeframe. Every employee misses work from time to time due to illness or other personal circumstances, but a high rate of absenteeism can be an indicator of more serious workplace concerns, such as a toxic work environment.
To calculate absence rate, divide the total number of unexcused absences within a timeframe by the number of work days within that timeframe and multiply by 100.

What is a good employee absence rate?
Similar to other retention metrics, absence rates vary by industry. However, a rate of 3-5% or lower is accepted as generally good, while a rate above 10% may be considered high.
Employee lifetime value
Employee lifetime value (ELTV) is a measure of value over the course of an employee’s time with your company. This is a useful measure that helps you understand employee output at various stages of the employee lifecycle.
This can be measured both as a monetary output as well as more intangible contributions by employees to things such as company culture and organizational innovation. Generally, employees with longer retention periods will have a higher ELTV.
There are countless factors that influence employee output, such as work environment, learning & development and more. The objective is to continuously refine your talent management strategy to maximize ELTV.
Retention metrics for employee onboarding
Retention metrics can provide you with critical insight into the employee experience both during and prior to their employment at your organization. This helps you identify and address any pain points or success markers in your current recruitment strategy, so you can make data-backed improvements for the future.
Here are a few retention metrics to consider tracking as part of your onboarding efforts:
Employee satisfaction in the first 30-60-90 days
This metric answers these questions:
- How do employees feel about their relationship with your organization at 30-60-90 days?
- Does this feeling change over the course of this time period? If it does, does it trend negatively or positively?
- What factors of the new employee experience are the most influential?
Employee turnover in first 30-60-90 days
This metric answers these questions:
- What percentage of new employees are leaving the company within this critical time period?
- What percentage of employees are retained past these same time periods?
- What distinguishes the experiences of employees that stayed with the company longer and the ones who left? Are there noticeable trends?
Retention metrics for learning and development
Learning and development (L&D) is not only an in-demand workforce benefit today but also a critical driver of long-term business growth and agility. Even so, many HR and L&D professionals still struggle to get buy-in from executive teams for their L&D strategy. Demonstrating the correlation between L&D, employee engagement and retention through defined metrics can help you do just that.
Percentage of employees enrolled in learning programs
This high-level metric helps you understand how many people (out of those who are eligible) are actually taking advantage of your L&D programs.
If these numbers are low, it’s possible that your employees don’t know how to enroll in these programs, don’t understand the benefits or they might not be aware of them altogether. These barriers can pose a major threat to the effectiveness of your efforts, so it’s important to always keep an eye on this metric and develop benchmarks to measure against.
Learner engagement and satisfaction
For employees that are actively taking part in learning opportunities, it’s important to understand their level of engagement and satisfaction. The exact metrics may vary based on the type of learning program, but here are some starting points to consider:
- For employees taking part in a formal training or workforce education program, how are they progressing?
- Are participating employees meeting or exceeding their learning objectives?
- How are participating employees performing on the job? Are they applying their new skills and knowledge to their existing roles?
- How do your employees feel about the range, accessibility and relevance to current and future career prospects offered by your menu of learning opportunities?
- How do participating employees feel their learning experience and skill-building are setting them up for success on the job?
You can gather this information through a combination of quantitative and qualitative methods. This level of measurement helps to show how effective, accessible and relevant your learning initiatives are.
Employee performance
Back up qualitative data with performance data that tracks employee productivity and success during and after the time that they’re actively engaging in learning opportunities.
For example, suppose that there’s an individual who recently completed a professional certification program that’s directly tied to their current role. Has their performance improved since earning the certification? Both hard and soft skills should be evaluated.
Employee retention rate for employees participating in L&D programs vs. those who are not
Calculate retention rates for employees who are actively engaging in your L&D benefits, and compare those rates to those who are not. There are many influential factors outside of L&D that can cause an employee to quit, so it’s important to remember that these factors are not always directly correlated. That said, this measurement can still help you spot trends and patterns, as well as identify which ones are worth taking a closer look at.
For instance, perhaps data reveals that those who leverage workforce education to earn a degree stay at the company longer than those who earn a professional certificate.
Start tracking the right retention metrics
In today’s competitive job market, retaining your top-performing employees is more important than ever. Tracking retention allows you to take a temperature check on the status of your workforce and understand what’s driving talent to leave the organization. The only thing more important than tracking metrics is what you do with them, so be sure to always follow up your findings with actions that are geared towards improving results. .
So, what’s next? Effectively measuring retention is the first step in improving it. Now, it’s time to take action. Access this guide to discover how you can leverage workforce education to attract and retain in-demand talent.

